Exploring additional dimensions
Predicate-specific patterns
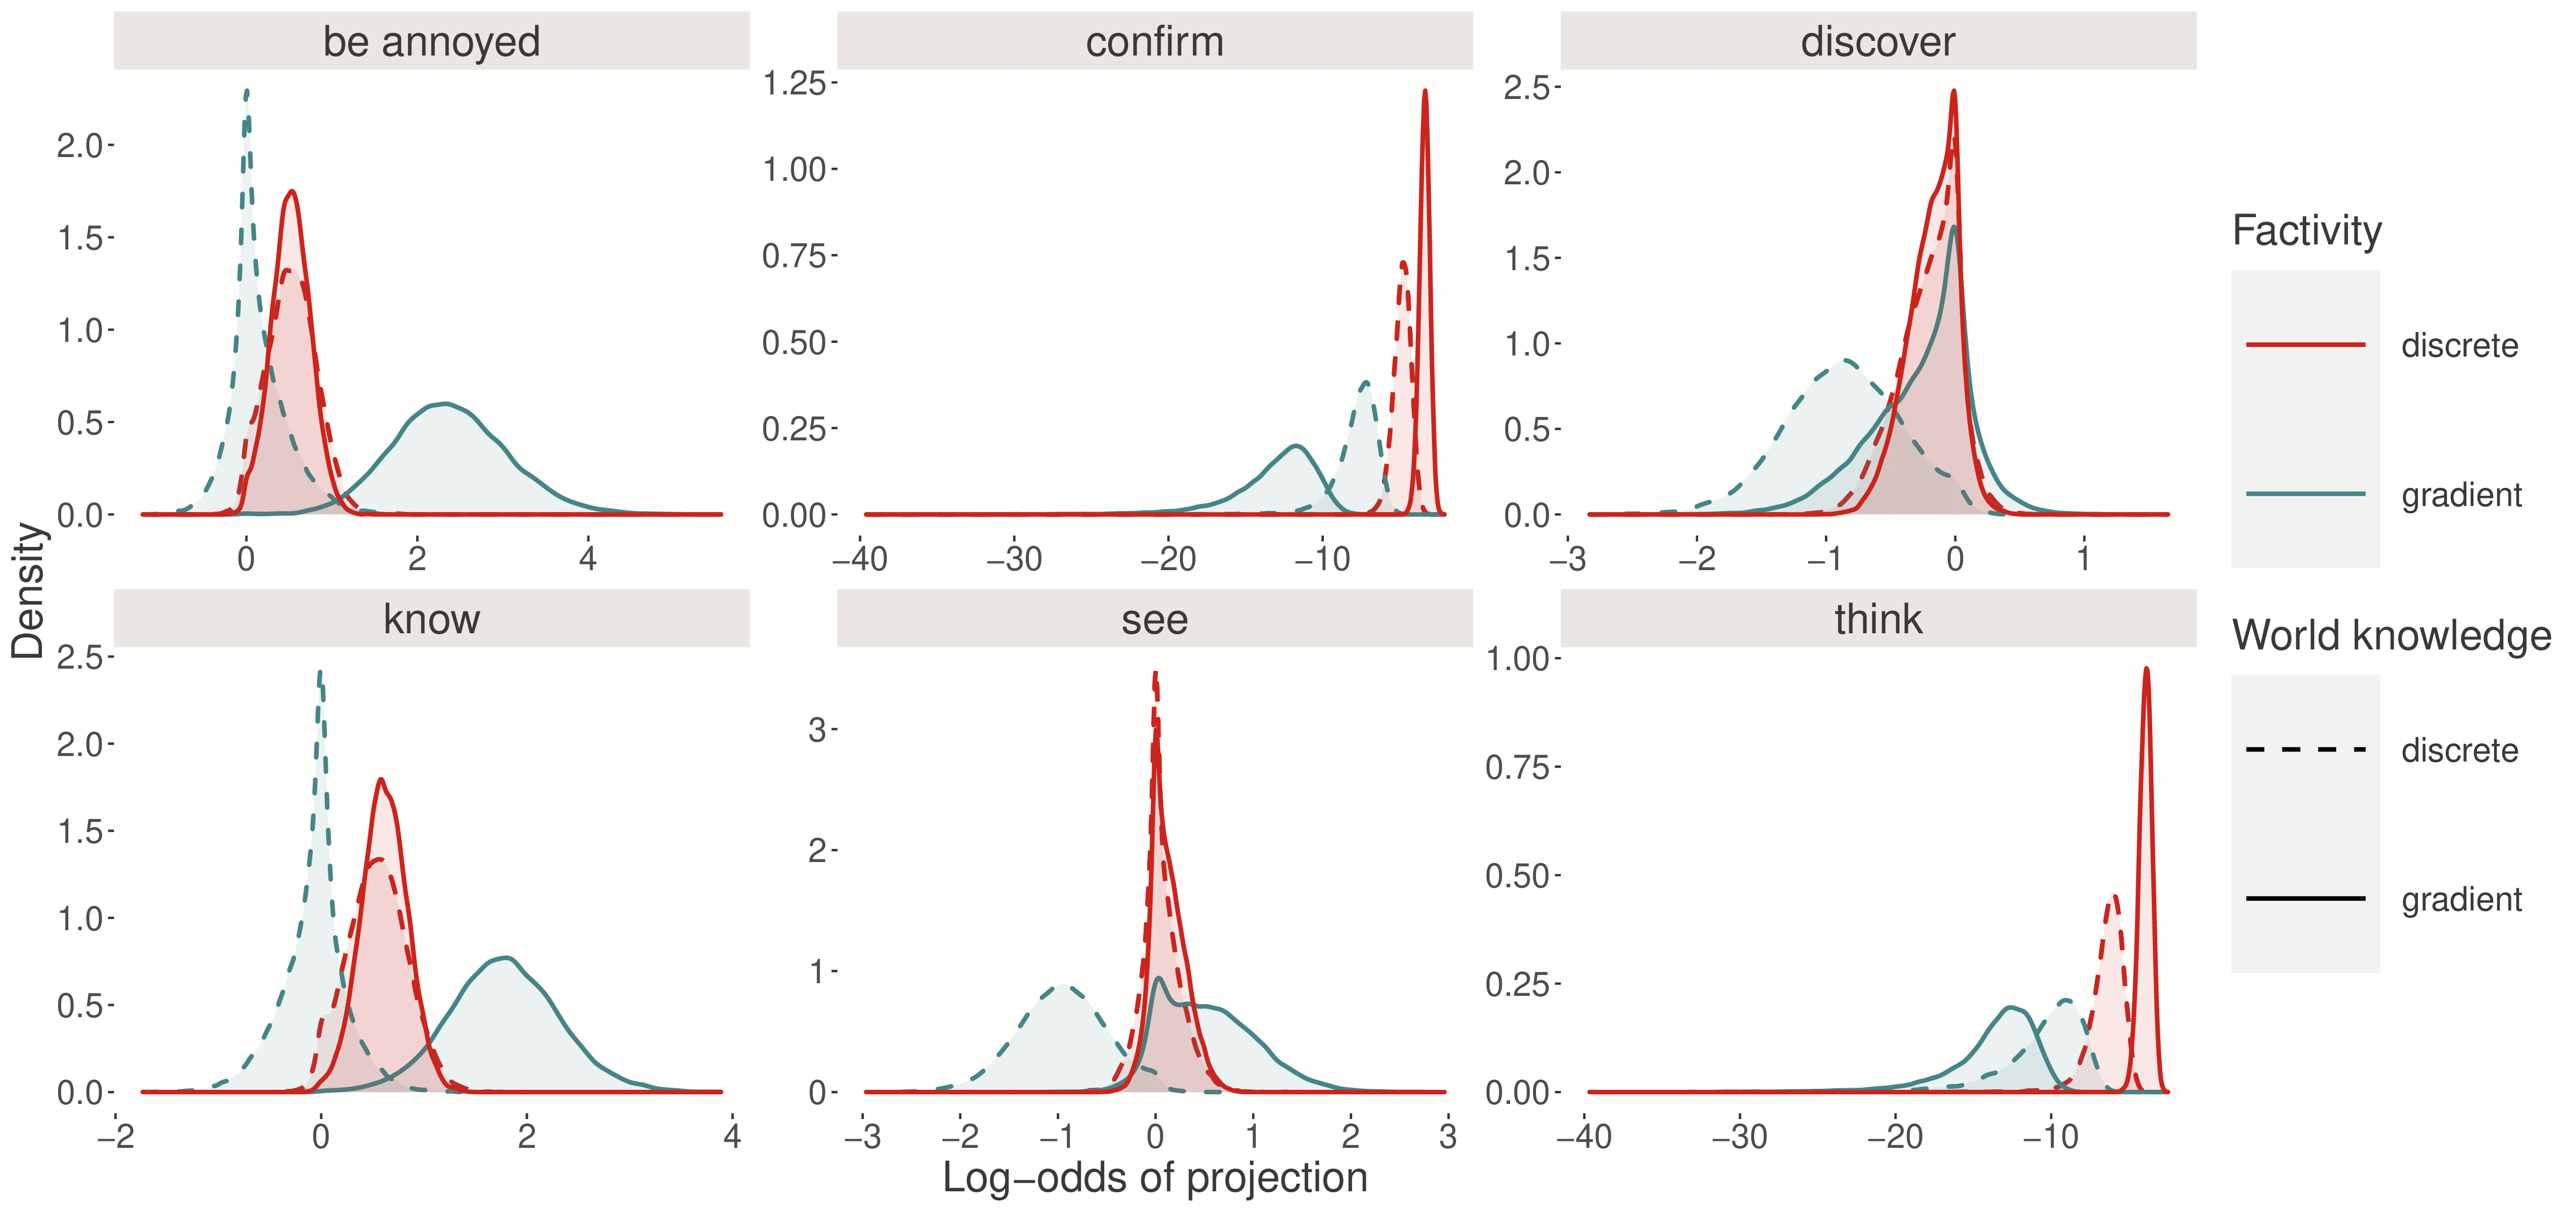
Not all predicates show the same degree of discreteness. We can examine the posterior distributions of the factivity parameter by predicate:

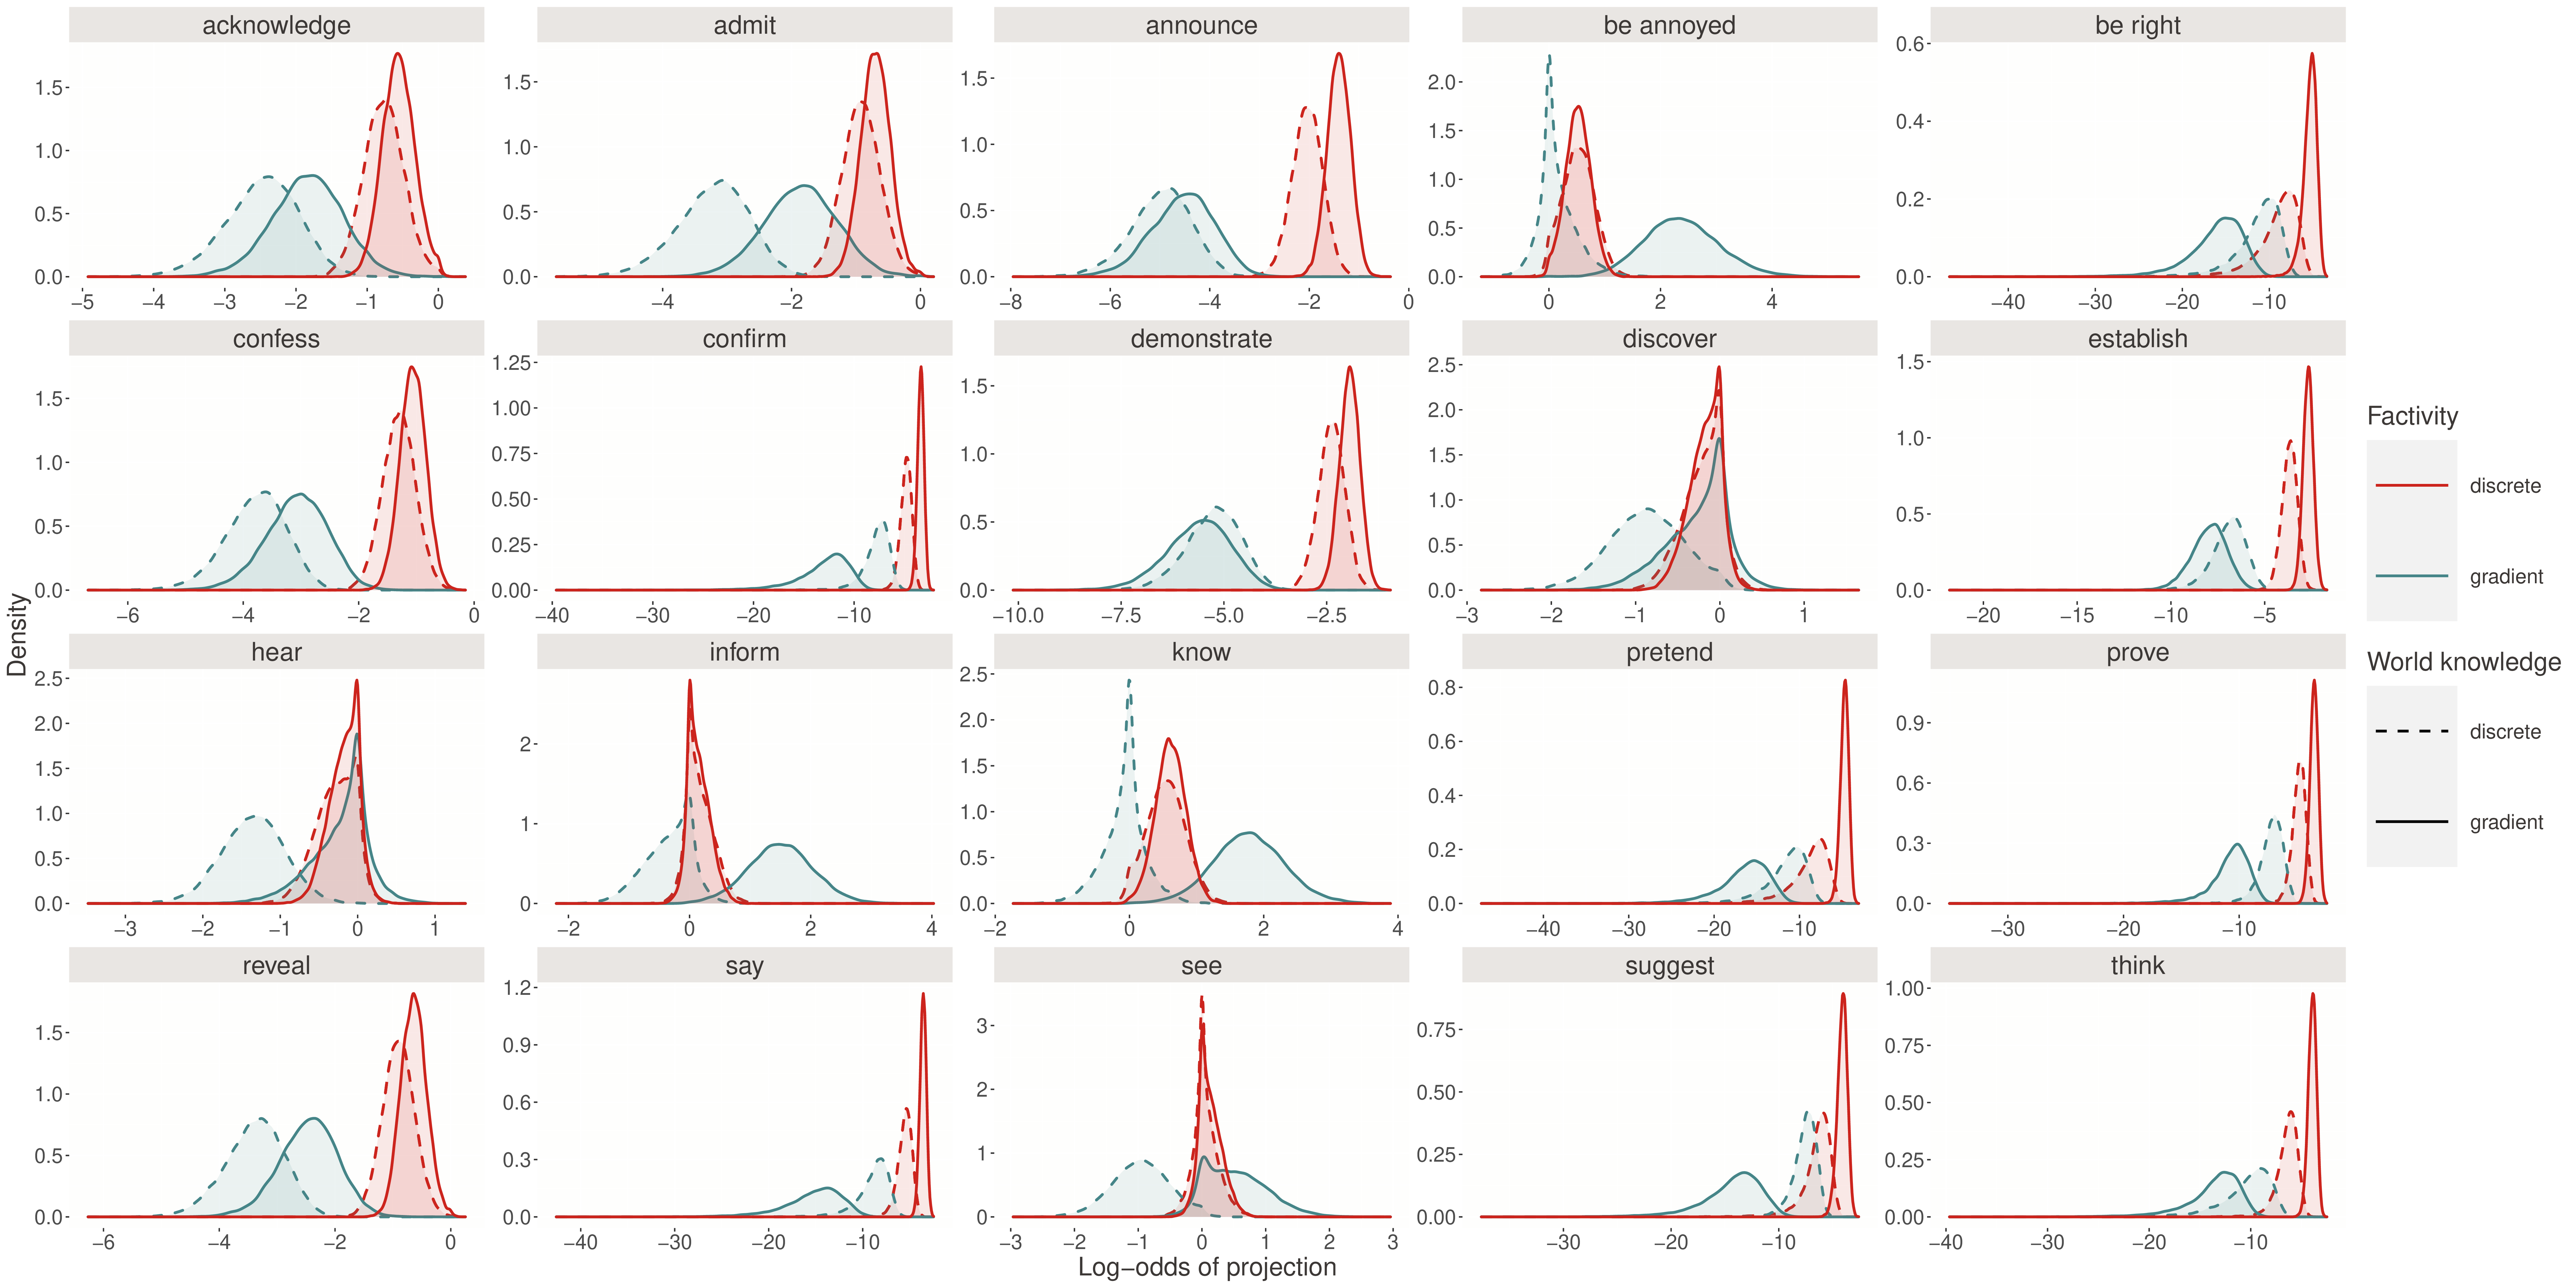
Several patterns emerge from these posterior distributions. Canonical factives like know and discover show high probability of being interpreted with factive presupposition across models, while non-factives like think and say show consistently low probability. The most interesting cases are variable predicates like confirm and prove, which show intermediate probabilities with high uncertainty. This variation suggests that while factivity is discrete at the token level (each use involves either a factive or non-factive interpretation), predicates differ systematically in their propensity to trigger factive interpretations.
For a complete view of all 20 predicates tested:

Context effects
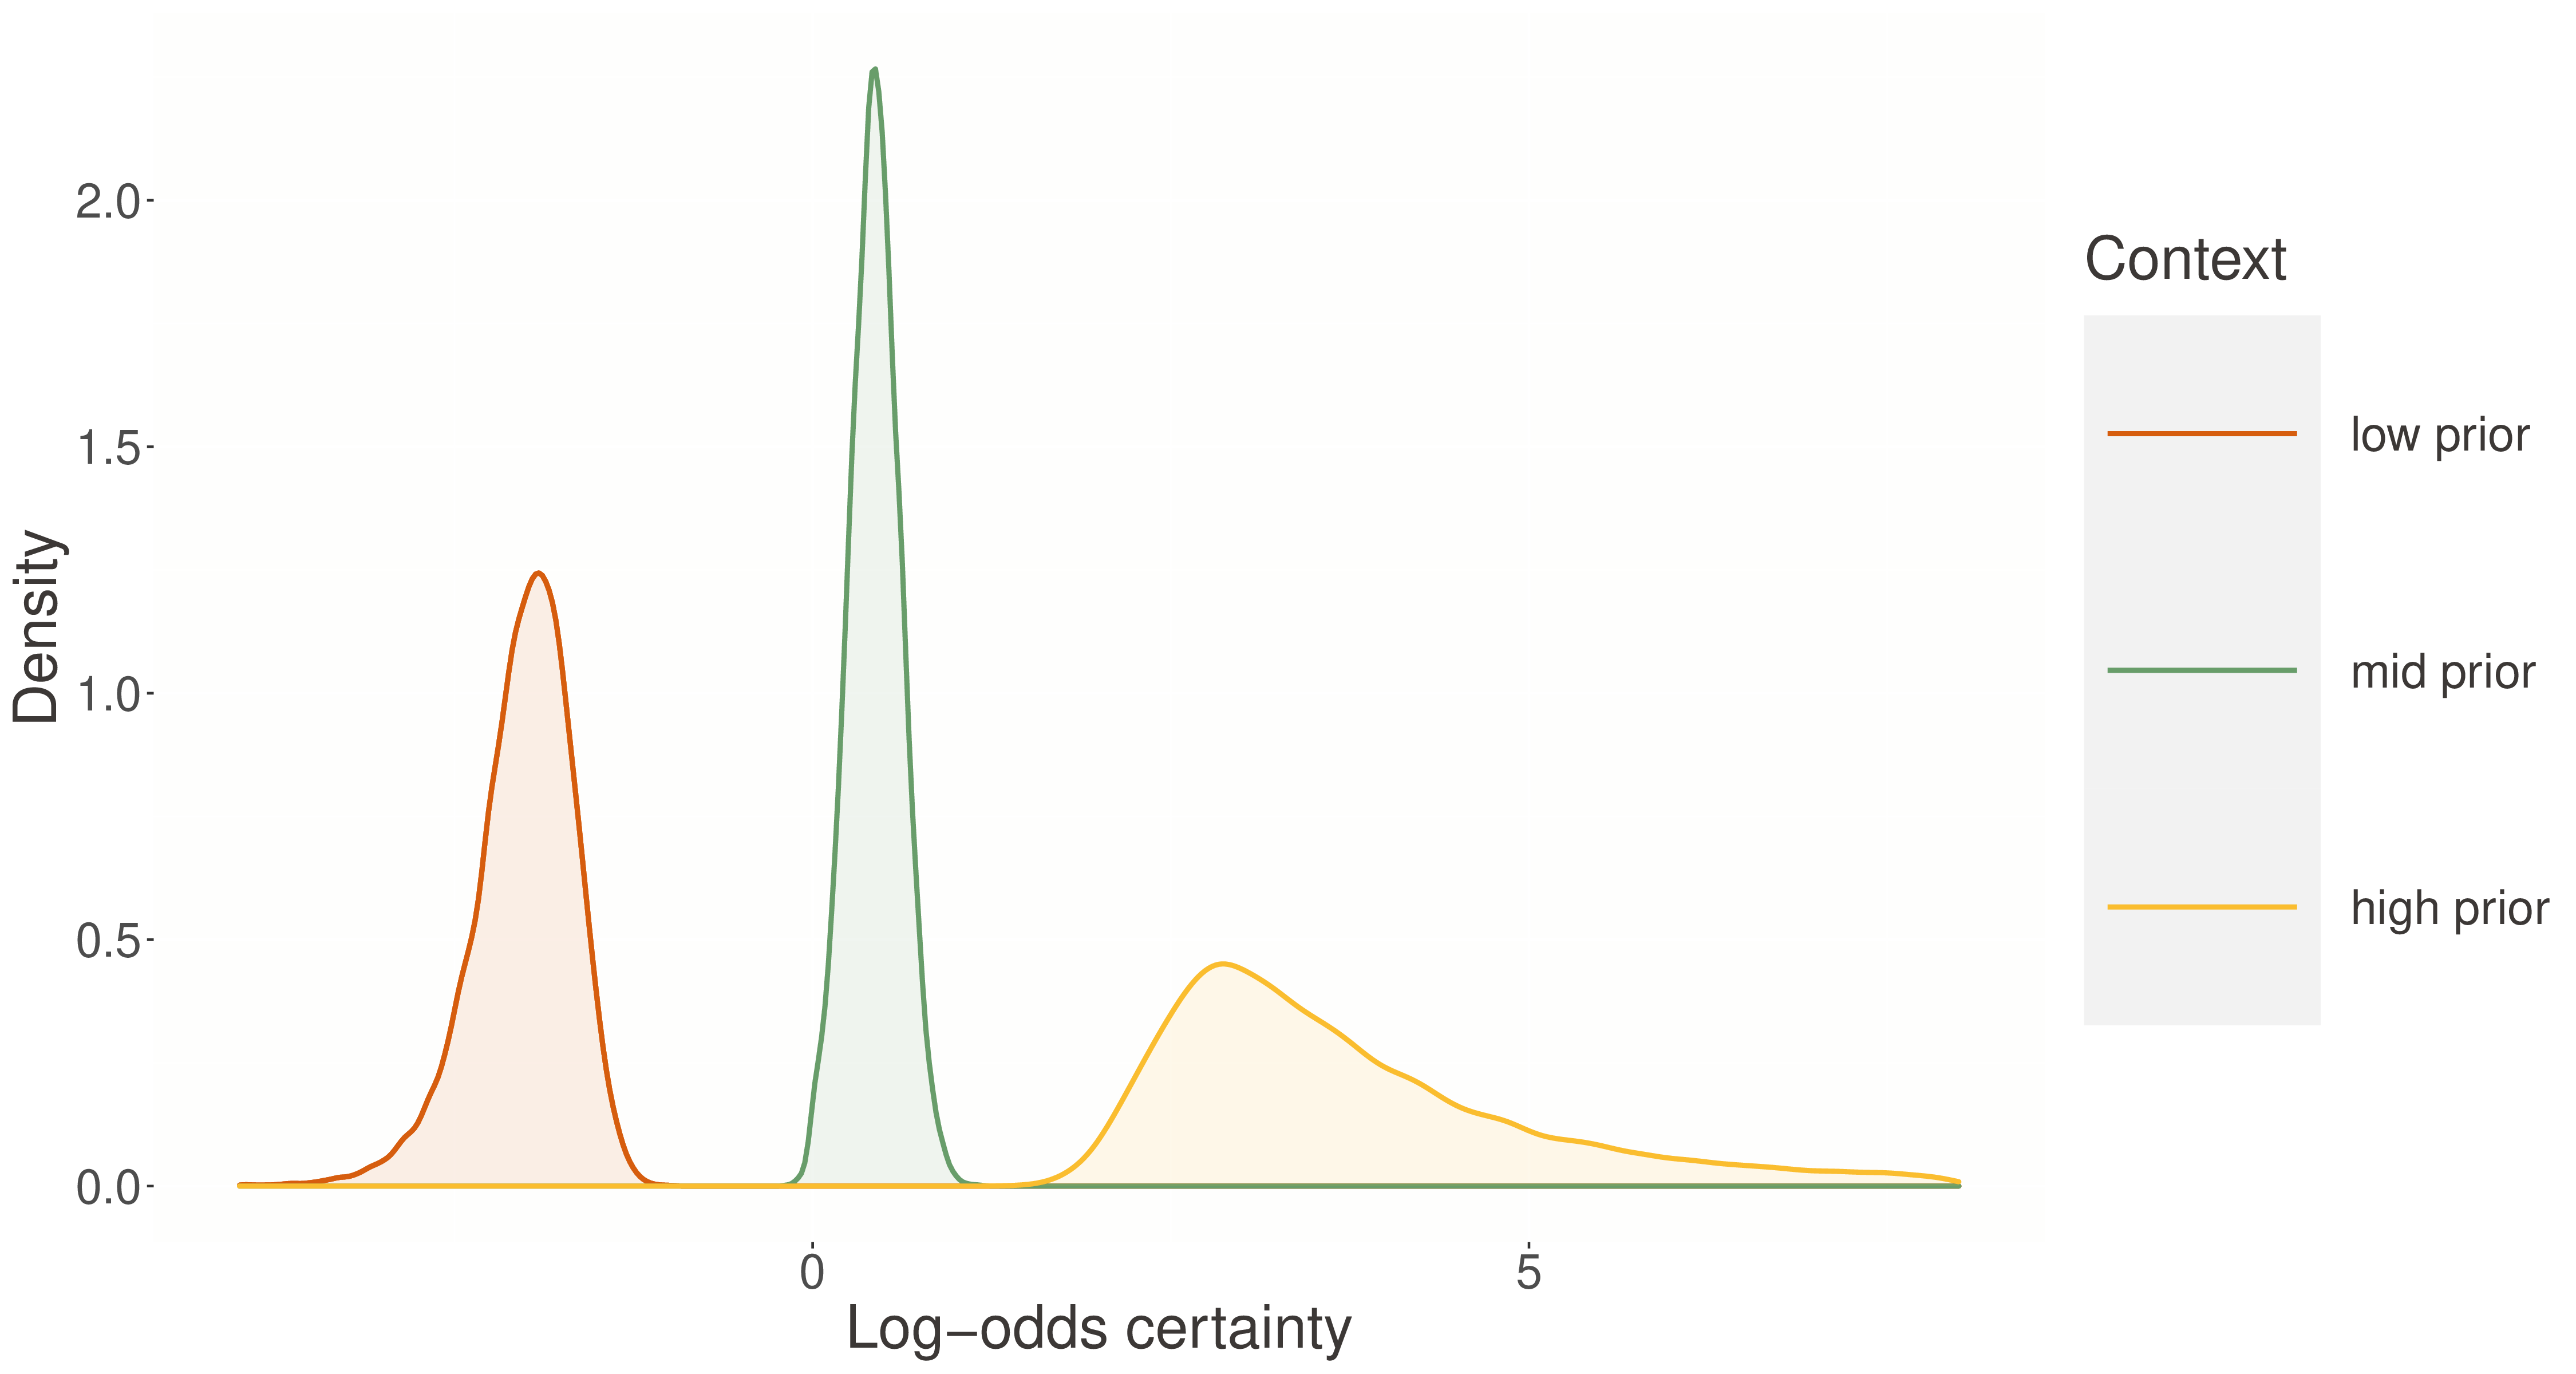
The norming study reveals how world knowledge varies across contexts:

The separation between low and high prior contexts validates the experimental manipulation—participants genuinely use world knowledge when judging likelihood. This makes the discrete-factivity model’s success more impressive: it must overcome this continuous variation to produce discrete projection patterns.
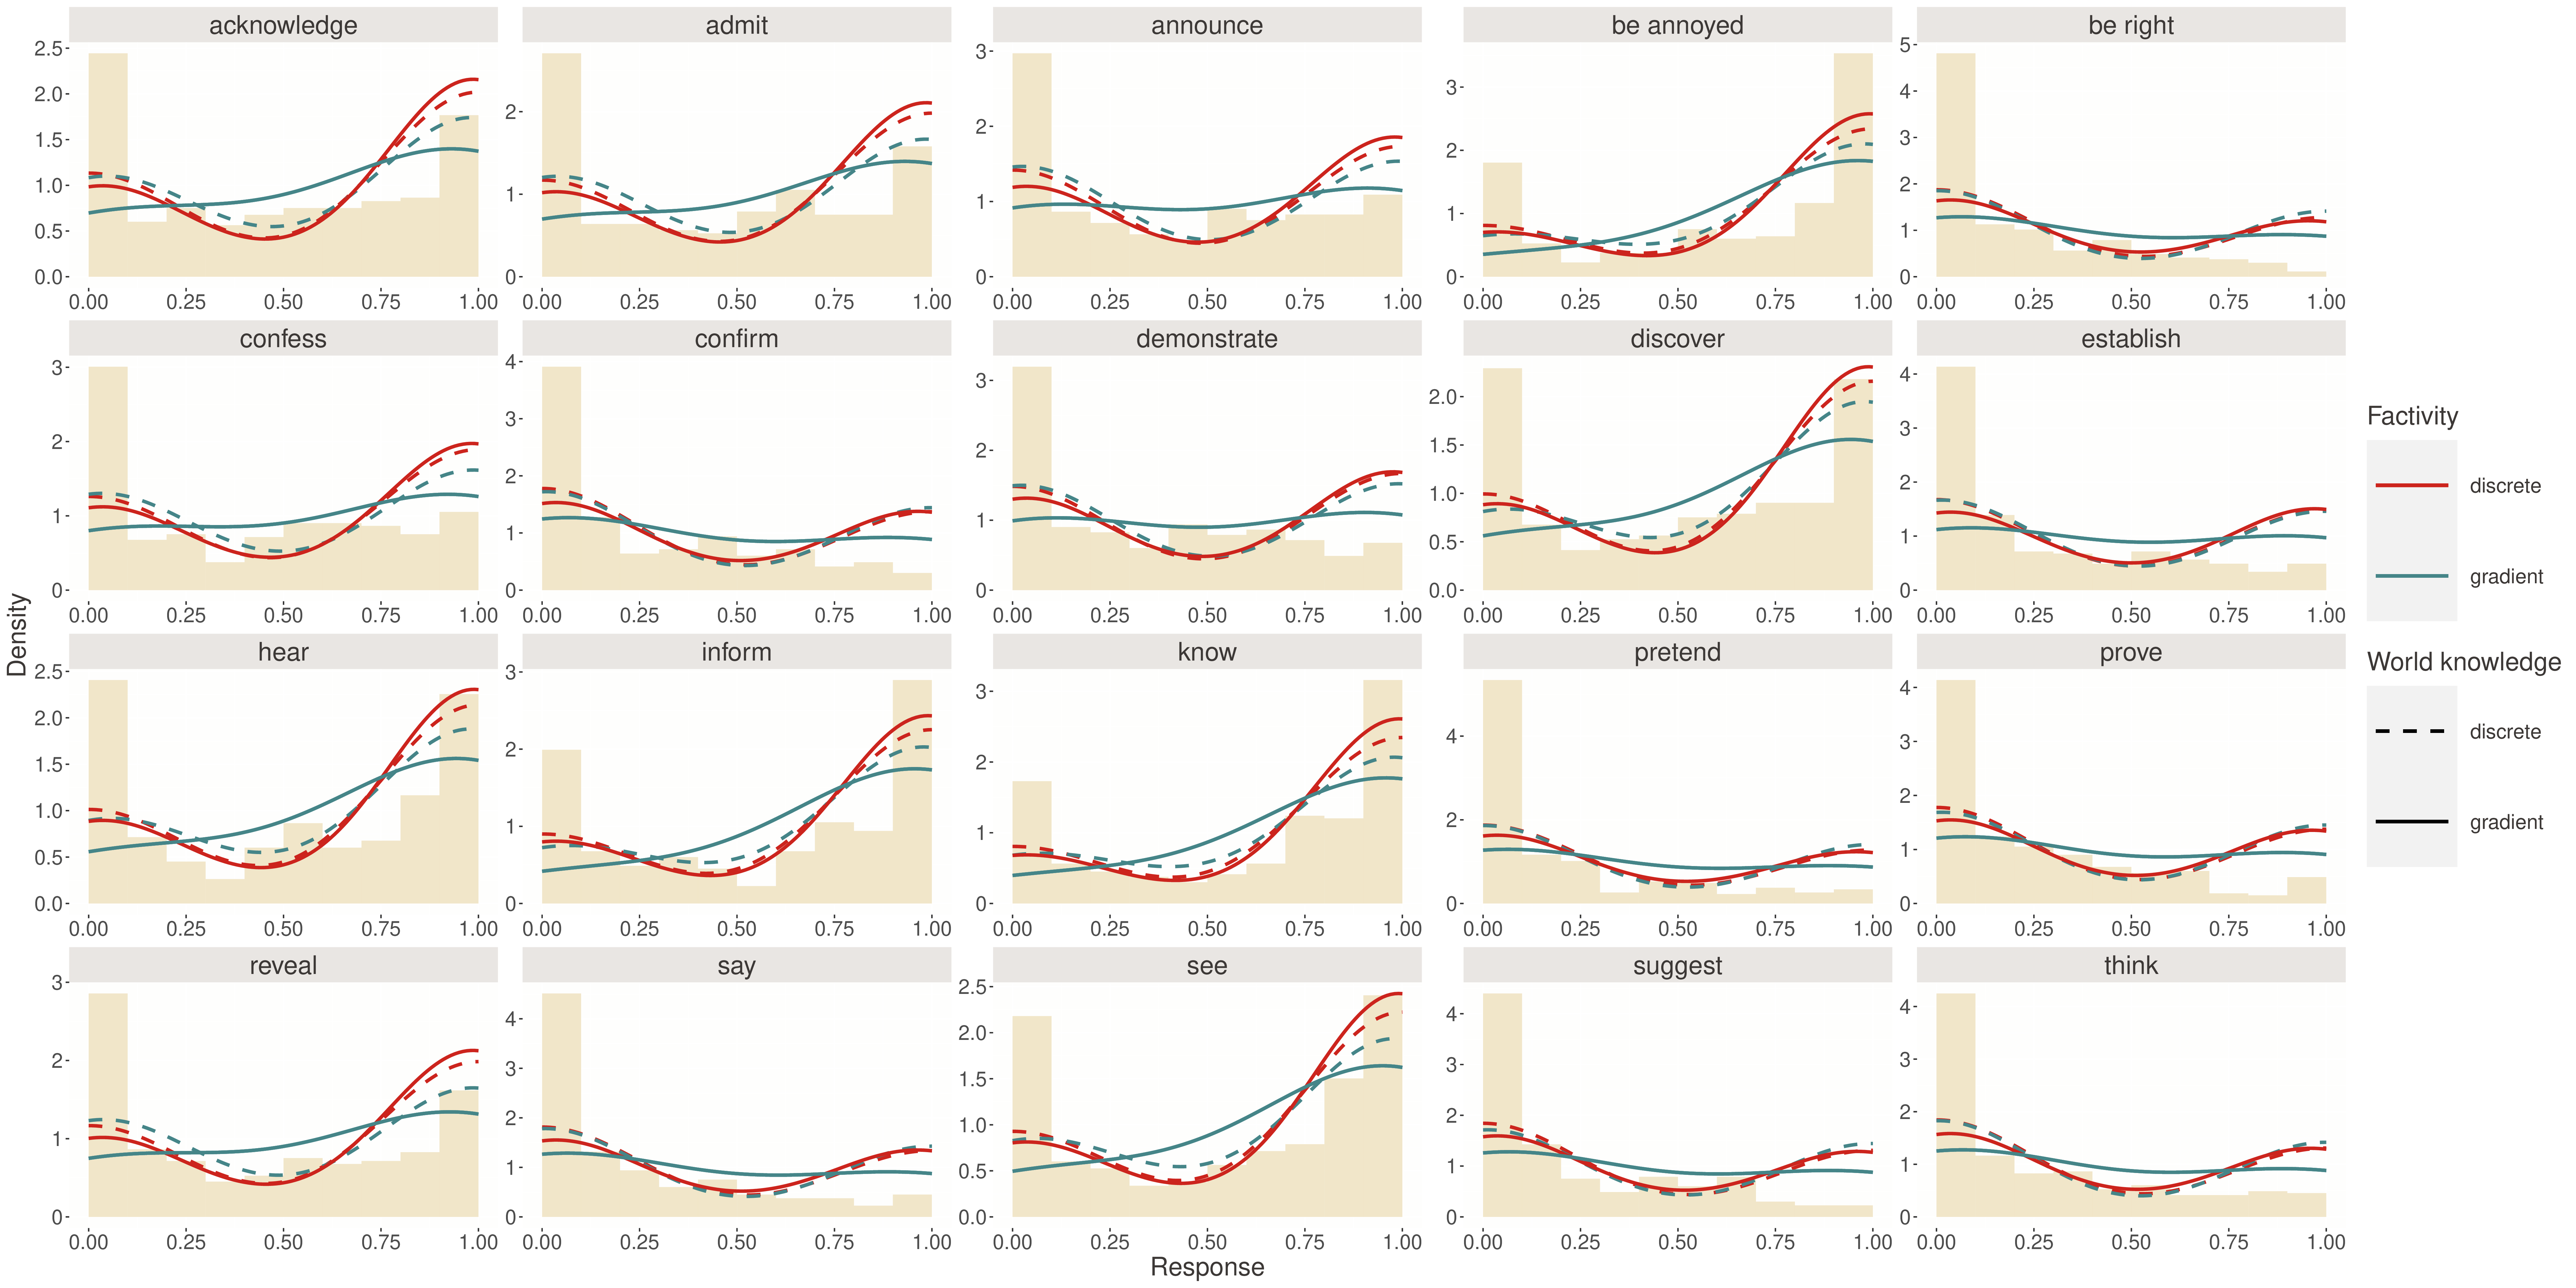
Complete posterior predictive distributions
For researchers interested in the full pattern across all predicates:
